logo
আরবি ভাষা শিক্ষক প্রশিক্ষণ কোর্স - নিবন্ধন করুন এখনি! x

Mastering Dashboard and KPI Analysis in Excel for MIS/Reporting

  • No Rating
  • (0 Reviews)
  • 0 students enrolled

Mastering Dashboard and KPI Analysis in Excel for MIS/Reporting

Its’ a Business Analytics & Intelligence course in MS Excel. The WHOLE Excel Mastery Series In One! for data analysis through Pivot Table and Dashboard for MIS Reporting By getting the course, Level up your data dashboard skills. This course will open you up to the world of dashboard design and management. Learn the latest data dashboard skills from experts with real-world experience. The data dashboard learning path arms you with the knowledge of Tableau design, Salesforce integration MIS/Reporting and more.
  • No Rating
  • (0 Reviews)
  • 0 students enrolled
  • 7500.00৳
  • 10000.00৳
  • Course Includes
  • A Business Analytics & Intelligence course for MIS
  • daily online support
  • Free performance review after 1 month
  • Completion Certificate


What learn

  • Its’ a Business Analytics & Intelligence course in MS Excel. The WHOLE Excel Mastery Series in One! for data analysis th...
  • • Create Professional Interactive Excel Dashboards from scratch
  • • Create over 10 Amazing Interactive Non-Standard Charts in Microsoft Excel. BONUS: Excel Workbook files + Sample files...
  • • Improve general Excel knowledge - Pivot Tables and Pivot Charts, Conditional Formatting, Functions, Formulas and Macro...
  • • Analyze Data with Excel PivotTables and Pivot Charts
  • • Learn how to create a professional KPI dashboard from scratch
  • • Build Interactive Dashboard Reports with Buttons and Drop Down Menus
  • • Understand and Identify the Principles of Data Analysis
  • • Analyze Excel data using Excel's based Functions
  • • Quizzes and exercises

Course Content

8 sections • 8 lectures •
1.Introduction; 2.Inserting Charts ; 3.Using Ideas 4.Chart Ribbons; 5.Pivot Charts; 6.Charting Elements

Day-1:

The Basics of Charting In Excel 

  • Introduction
  • Inserting Charts
  • Using Ideas
  • Chart Ribbons
  • Pivot Charts
  • Charting Elements
mb
• 1.Principles of Data visualization Introduction; • 2.Principles of visualizations; • 3.Good and Bad charts;


Day-1:

Principles of Data visualization

  • Principles of Data visualization Introduction
  • Principles of visualizations
  • Good and Bad charts
mb
• 1.Mastering common Charts Intro; • 2.Working with Line charts and Trendlines; • 3.Working with Bar and Column Charts in Excel;

Day-2:

Mastering Common Charts

  • Mastering common Charts Intro
  • Working with Line charts and Trendlines
  • Working with Bar and Column Charts in Excel
  • An introduction to Histograms
  • Working with Histogram and Pareto Charts in Excel
  • Pie and Donut Charts
  • Scatter Charts
  • Working with Scatter Charts in Excel
  • Filled Maps in Excel
mb
• 1.An introduction to bubble charts; • 2.Bubble charts; • 3.Introducing Waterfall charts;

Day-3:

Mastering Less Common Charts

  • An introduction to bubble charts
  • Bubble charts
  • Introducing Waterfall charts
  • Working with Excels Waterfall charts
  • Getting started with Waterfall charts
  • working with Combination charts in Excel
  • Sparklines
  • Stock Image Dashboard in Excel
mb
• 1.Lets talk about Dashboards Introduction; • 2.What is a Dashboard; • 3.Where to start when designing a dashboard;

Day-4:

Lets talk about Dashboards

  • Lets talk about Dashboards Introduction
  • What is a Dashboard
  • Where to start when designing a dashboard
  • Dashboard Don'ts
  • Why use Excel
  • Good and bad dashboard examples
mb
• 1.Creating dynamic charts Introduction; • 2.Creating a custom visual overlay; • 3.Dynamic Sales V's Budget;

Day-4:

Creating dynamic charts

  • Creating dynamic charts Introduction
  • Creating a custom visual overlay
  • Dynamic Sales V's Budget
  • Sales V's Budget part
  • Creating Dynamic Legends
  • Formatting based on values
  • Dynamic formatting based on criteria
  • How and why to fix an axis on dynamic and multiple charts
mb
• 1.Automating interactive Charts Introduction; • 2.Automating Charts with names ranges; • 3.Dynamic ranges for subsets of data;

Day-5:

Automating interactive Charts

  • Automating interactive Charts Introduction
  • Automating Charts with names ranges
  • Dynamic ranges for subsets of data
  • Change charting period with dropdown
  • Changing charts with form controls
mb
• 1.workbooks for this section; • 2.Building the final dashboards Introduction; • 3.High level dashboard;

Day-5:


Building the final dashboards

  • workbooks for this section
  • Building the final dashboards Introduction
  • High level dashboard
  • Dashboard protection and finishing touches
  • Our second dashboard
  • The Third Dashboard
  • Linking and other dashboard tips
  • Course Conclusion


mb

Requirements

  • 1. This course was recorded with Excel 2016, but it's compatible also with Excel 2013 and 2019 2. It is only compatible with Microsoft Office 3. Only basic prior experience in Excel or spreadsheets is required to get the most out of this Excel course

Description

Mastering Dashboard and Data Analysis in Excel for MIS/Reporting+


Assalamu Alaikum

Introducing Mastering Dashboard and Data Analysis in Excel for MIS/Reporting+

through which you can visualize and redesign reports. The product of this course is so user friendly that you can fully customize it as you like and control data for management reporting. By learning this course you can evaluate data, create Pivot table and visualize through table, charts whatever you like. The main benefit of this training is that it will develop and improve both your efficiency and productivity and save working time.


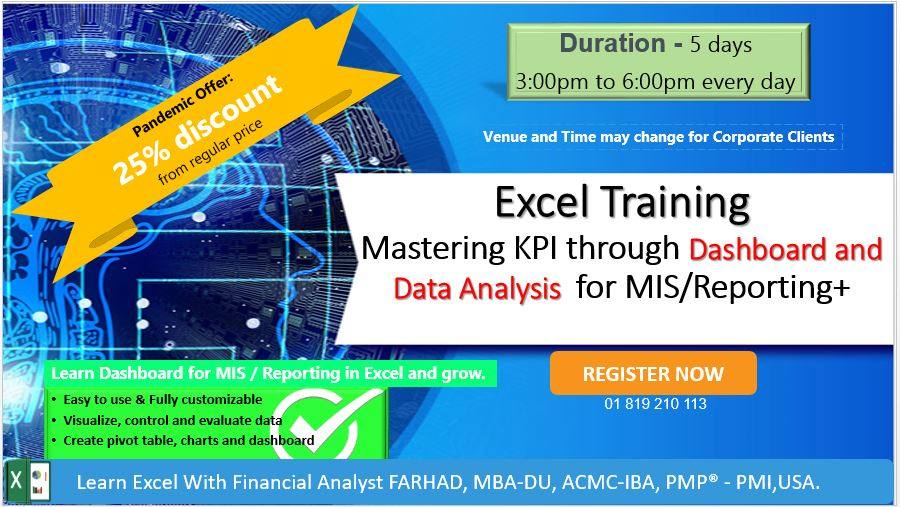
The total duration of this course is five days and you can do this course at 25% discount due to pendamic.


Let's review our training.


 We honor your data security. In this training we will teach you how to Protect data from unauthorized file opening or sheet viewing.

you'll also;

  • Create Professional Interactive Excel Dashboards from scratch
  • Create over 10 Amazing Interactive Non-Standard Charts in Microsoft Excel. BONUS: Excel Workbook files + Sample files included
  • Improve general Excel knowledge - Pivot Tables and Pivot Charts, Conditional Formatting, Functions, Formulas and Macros
  • Analyze Data with Excel PivotTables and Pivot Charts
  • Learn how to create a professional KPI dashboard from scratch
  • Build Interactive Dashboard Reports with Buttons and Drop Down Menus
  • Learn from an instructor with over 20 years of experience with Microsoft Excel, teaching thousands of students.
  • Understand and Identify the Principles of Data Analysis
  • Analyze Excel data using Excel's based Functions
  • Quizzes and exercises


In addition, we offer you a daily online support and a free performance review after 1 month. We are the pioneer as free performance reviewer in Bangladesh. We are giving you 25% pandamic discount from regular price. So what else do you want.

The course is  absolutely design for you. Only basic prior experience in Excel or spreadsheets is required to get the most out of this Excel course


 Thanks for being with us.

Course content

8 sections • 5 lectures • 15h 


Day-1:

The Basics of Charting In Excel 

  • Introduction
  • Inserting Charts
  • Using Ideas
  • Chart Ribbons
  • Pivot Charts
  • Charting Elements


Principles of Data visualization

  • Principles of Data visualization Introduction
  • Principles of visualizations
  • Good and Bad charts


Day-2:

Mastering Common Charts

  • Mastering common Charts Intro
  • Working with Line charts and Trendlines
  • Working with Bar and Column Charts in Excel
  • An introduction to Histograms
  • Working with Histogram and Pareto Charts in Excel
  • Pie and Donut Charts
  • Scatter Charts
  • Working with Scatter Charts in Excel
  • Filled Maps in Excel


Day-3:

Mastering Less Common Charts

  • An introduction to bubble charts
  • Bubble charts
  • Introducing Waterfall charts
  • Working with Excels Waterfall charts
  • Getting started with Waterfall charts
  • working with Combination charts in Excel
  • Sparklines
  • Stock Image Dashboard in Excel


Day-4:

Lets talk about Dashboards

  • Lets talk about Dashboards Introduction
  • What is a Dashboard
  • Where to start when designing a dashboard
  • Dashboard Don'ts
  • Why use Excel
  • Good and bad dashboard examples

Creating dynamic charts

  • Creating dynamic charts Introduction
  • Creating a custom visual overlay
  • Dynamic Sales V's Budget
  • Sales V's Budget part
  • Creating Dynamic Legends
  • Formatting based on values
  • Dynamic formatting based on criteria
  • How and why to fix an axis on dynamic and multiple charts


Day-5:

Automating interactive Charts

  • Automating interactive Charts Introduction
  • Automating Charts with names ranges
  • Dynamic ranges for subsets of data
  • Change charting period with dropdown
  • Changing charts with form controls


Building the final dashboards

  • workbooks for this section
  • Building the final dashboards Introduction
  • High level dashboard
  • Dashboard protection and finishing touches
  • Our second dashboard
  • The Third Dashboard
  • Linking and other dashboard tips
  • Course Conclusion


Recent Courses

blog
  • March, 26th 2024
  • 6

অনারবীদের আরবি ভাষা শিক্ষা নিয়ে গবেষণার জন্য বিশ্ব বিখ্যাত প্রতিষ্ঠান ‘আল-আরাবিয়্যাতু লিল জামী’-এর সরাসরি তত্ত্বাবধান ও পরিচা..

  • 3000.00৳
blog
  • February, 12th 2024
  • 1

আপনি কি কুরআন বুঝা, আরবিতে সাবলীল কথোপকথন, বইপড়া ও আরবি মিডিয়াম বিশ্ববিদ্যালয়ে অধ্যয়নের উপযুক্ত হিসেবে নিজেকে গড়ে তুলতে চান?..

  • Free
blog
  • March, 20th 2024
  • 0

আপনি কি মহিলা মাদরাসা থেকে পড়াশোনা শেষ করেছেন? আরবি ভাষার প্রতিটি দিক সহজ ও কার্যকরভাবে শেখানোর কলাকৌশল আয়ত্ব করতে চান? তাজ..

  • 1000.00৳
blog
  • March, 18th 2024
  • 0

سلسلة من المحاضرات الخاصة بمعلمي ومعلمات اللغة العربية لغير الناطقين بها للارتقاء بمعارفهم ومهاراتهم التعليمية لتسهيل تعليم ا..

  • 3000.00৳

About Instructor

instructor
About Instructor

𝐿𝑒𝑎𝑟𝑛 𝐸𝑥𝑐𝑒𝑙 𝑊𝑖𝑡ℎ 𝐹𝑖𝑛𝑎𝑛𝑐𝑖𝑎𝑙 𝐴𝑛𝑎𝑙𝑦𝑠𝑡 𝐅𝐀𝐑𝐇𝐀𝐃, 𝑀𝐵𝐴-𝐷𝑈, 𝐴𝐶𝑀𝐶-𝐼𝐵𝐴, 𝑃𝑀𝑃® - 𝑃𝑀𝐼,𝑈𝑆𝐴. I’m a uniquely qualified Finance Manager with twenty years’ progressively responsible experience to achieve your organizational strategic objectives. I’m highly proficient in managing budgeting processes, along with mid-year forecasting and ability to analyze current as well as past trends in MS EXCEL. 𝙇𝙞𝙨𝙩 𝙤𝙛 𝙁𝙚𝙬 𝘾𝙤𝙪𝙧𝙨𝙚𝙨: 1. Finance for Non Finance Professional. 2. Training on Developing ERP APPLICATION in Excel and Implementation For Individual User 3. Training on Excel to Develop Beginner to Intermediate User 4. Training on Preparing Customized Dashboard and Pivot Table in Excel for MIS/Reporting